3. Line graph
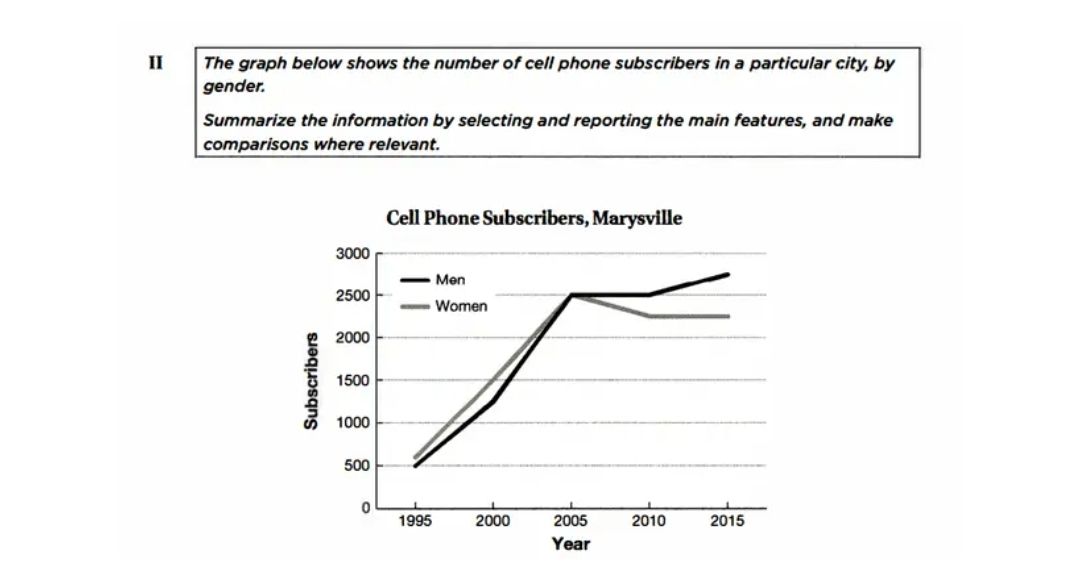
The graph shows the number of cell phone subscribers in Marysville, by gender. Summarize the information by selecting and reporting the main features, and make comparisons where relevant.

The graph shows how many men and women in Marysville paid for cell phone service from 1995 to 2015.
Overall, while the numbers of both male and female subscribers rose significantly, they rose more for men.
The number of male cell phone subscribers rose significantly between 1995 and 2015. In 1995, a little over 500 men subscribed to cell phone service. The number increased considerably over the next few years until it reached 2500 in the year 2005. There was no change in the number of subscribers between 2005 and 2010. Then, the number rose slightly between 2010 and 2015, when there were about 2750 male subscribers.
Similarly, the number of women subscribing to cell phone service rose in most years between 1995 and 2015. In 1995, 500 women subscribed to cell phone service. By 2005, the number of female subscribers had increased to 2500. There was a slight drop to about 2250 subscribers between 2005 and 2010, and that number stayed steady between 2010 and 2015.
Bạn đang đọc truyện trên: AzTruyen.Top